یہ مضمون ابھی اس زبان میں دستیاب نہیں۔ آپ انگریزی نسخہ پڑھ رہے ہیں۔
Explainer Video Examples: 12 Videos Broken Down by Structure
بذریعہ Potto AI Team·
Twelve explainer video examples from Potto's own samples, each broken down by use, length, aspect ratio, scene order and the structure you can borrow.
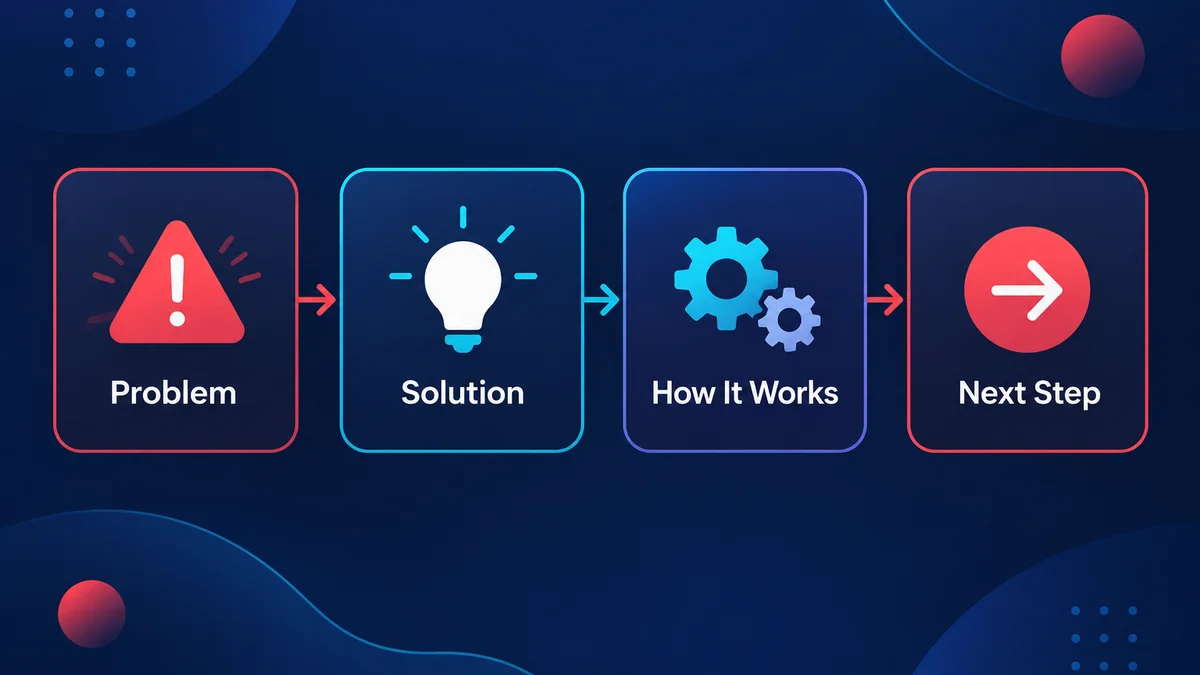
The best explainer video examples all reduce to the same four-part structure: a problem the viewer recognises, a solution in one sentence, a few steps that show how it works, and a clear next step. This guide breaks down 12 explainer video examples by that structure. All 12 are real sample videos from Potto's own pages, and for each one it lists the use, length, aspect ratio, scene order and the structure you can borrow for your own video.
One caution first: Potto wrote the source material behind the document-based samples, so every company, person and figure in them is fictional, and none is a customer project. They show what an input and a sentence of direction produce, not campaign results. For the definition, types and costs, read what an explainer video is; this page is the gallery. To build one as you read, Potto's explainer video maker takes a topic, a link or a document and gives you a storyboard to review before you export.
What to look for in an explainer video example
Three public guides describe nearly the same shape. TechSmith's explainer video guide gives a template for a roughly one-minute video: a hook from 0 to 10 seconds that presents the problem, an explanation from 10 to 50 seconds that shows how the solution works, and a call to action from 50 to 60 seconds. Vyond describes the classic explainer as a short video of one to two minutes and lists three moves: focus on the pain point, introduce a solution, then reveal the product as the solution. Adobe suggests keeping an explainer under 90 seconds, describes a flow of problem, solution and outcome, and advises captions and a format that matches the platform.
These are publisher guidelines, not a standard, but they agree. Each breakdown below uses the same four labels:
Problem: the question, situation or headline that tells the viewer why to keep watching.
Solution: the one-sentence answer.
How it works: the scenes that carry the steps, numbers or evidence.
Next step: how the video ends, whether that is a call to action, a takeaway or a stated limit.
How the 12 examples were chosen
Every example is a sample you can play on a Potto page, so you can check each description against the video. The table summarises all 12; the sections after it give the scene order and the structure to borrow.
Potto AI
اپنی اگلی لانچ ویڈیو بنائیں۔
جو چیز آپ کی دلچسپی کا باعث بنی اسے اپنی ویڈیو یا امیج میں بدلیں۔ اسکرین شاٹس، کوئی موضوع یا کوئی پرومپٹ لے آئیں۔
#
Example
Job
Ratio
Length
Scenes
1
Product demo from three screenshots
SaaS demo
16:9
27.8 s
5
2
Feature walkthrough from a page link
SaaS how-to
16:9
30.0 s
5
3
Onboarding walkthrough
Onboarding
16:9
10.0 s
3
4
Concept lesson
Education
16:9
22.5 s
5
5
Handout turned into a six-step lesson
Course
16:9
39.5 s
8
6
Process training clip
Training
16:9
10.8 s
3
7
Annual report explainer
Report
16:9
58.7 s
6
8
Square report summary
Report
1:1
22.1 s
5
9
Quarterly review from a slide deck
Deck
16:9
47.4 s
8
10
Monthly sales bar chart
Data
16:9
23.0 s
4
11
Article summary for phones
Article
9:16
28.0 s
5
12
Study summary for phones
Research
9:16
24.9 s
5
Lengths are the sum of the scene timings in each sample. Potto's target lengths are 15, 30, 45, 60 or 90 seconds, and a few samples land above their target because the final timing follows the script.
Product and SaaS explainer video examples
A SaaS explainer shows a viewer what the product does for a task they already have. These three suit the product demo video format.
1. Product demo from three screenshots
Use: show how to create an image with Potto's own image generator, made from the page link and three uploaded screenshots.
Format: 16:9, 27.8 seconds, five scenes, narrated.
Scene order: three screenshot scenes, a features scene, a call to action.
Problem: the opening line asks whether you need a product image.
Solution: the image generator, with a brief as the starting point.
How it works: one screenshot per step. Write a brief, type three short lines (what to show, how it should look, where the headline goes), then pick a model.
Next step: a features scene lists what happens after generation (compare, download, keep editing), then a closing call to action names the page.
Borrow: one verb and one caption per screenshot; let the narration add the reason, not repeat the caption.
2. Feature walkthrough from a page link
Use: explain one feature step by step, made from the link to Potto's background remover page with the feature walkthrough video type.
Format: 16:9, 30.0 seconds, five scenes, with music and no voiceover.
Scene order: hook, screenshot, list, compare, call to action.
Problem: the hook promises a clean cutout in three steps.
Solution: the background remover, named in the subtitle.
How it works: the captured page shows the upload step with its file limit, a list covers removing the background and checking the silhouette, and a compare scene sets a transparent cutout against a flattened composite.
Next step: a call to action to try the tool.
Borrow: end a how-to on a compare scene when the viewer must choose. With no narration, short complete labels carry the message. The product walkthrough video page shows more of this format.
3. Onboarding walkthrough
Use: welcome a new user and point them to their first three steps.
Format: 16:9, 10.0 seconds, three scenes.
Scene order: title, list, illustration.
Problem and solution: a welcome title sets the context.
How it works: a list of three actions: create your first project, invite your team, share your first report.
Next step: an illustration shows the first report as the result.
Borrow: end on the outcome the user gets, not on a request.
Course and training explainer video examples
Educational explainers teach instead of sell. The solution is an explanation, and the ending is often a check for understanding.
4. Concept lesson
Use: explain one concept with an example and a chart. This sample is a lesson on compound interest on the explainer video page.
Format: 16:9, 22.5 seconds, five scenes.
Scene order: title, illustration, list, chart, quote.
Problem: the title poses the question, "What is compound interest?"
Solution: the illustration carries the idea of money that earns money.
How it works: a list gives three points (interest on savings, interest on the interest, time does the work), then a bar chart shows $100 at 5% a year at year 1, year 5 and year 10.
Next step: a quote scene ends on a single takeaway. The sample hedges its Einstein line as "often attributed".
Borrow: example before numbers, and keep a hedge such as "often attributed" in the same scene as the claim.
5. Handout turned into a six-step lesson
Use: turn a course handout into a lesson. The sample starts from a biology handout on photosynthesis uploaded as a PDF.
Format: 16:9, 39.5 seconds, eight scenes.
Scene order: hook, list, title, illustration, quote, title, quote, list.
Problem: the hook states the topic as "Photosynthesis in 6 steps", from the handout.
Solution: the six steps themselves, in order.
How it works: each of steps one to six gets one scene and one idea, with the first step shown as a list of three inputs (light, water, carbon dioxide).
Next step: a closing list of check-yourself questions, such as where the light reactions happen.
Borrow: one idea per screen, and an ending that makes the viewer answer. The PDF to video converter suits sources ordered like this handout.
6. Process training clip
Use: walk through an approved process and separate the normal path from the exceptions. The sample is a refund approval.
Format: 16:9, 10.8 seconds, three scenes.
Scene order: title, list, compare.
Problem: the title names the process, "Refund approval, step by step".
Solution: three actions in a list: check the order, confirm the reason, approve or escalate.
How it works: the list is the process itself.
Next step: a compare scene sets the normal path (approve within the limit) against the exception (escalate to a lead).
Borrow: finish training on the decision rule, and have the process owner review the video.
Report and slide deck explainer video examples
Reports and decks already contain the content; the skill is choosing the three or four facts that carry the message. These come from a sample sustainability report for a fictional coffee company and a sample Q3 deck for a fictional bike company, which the PPT to video page also uses.
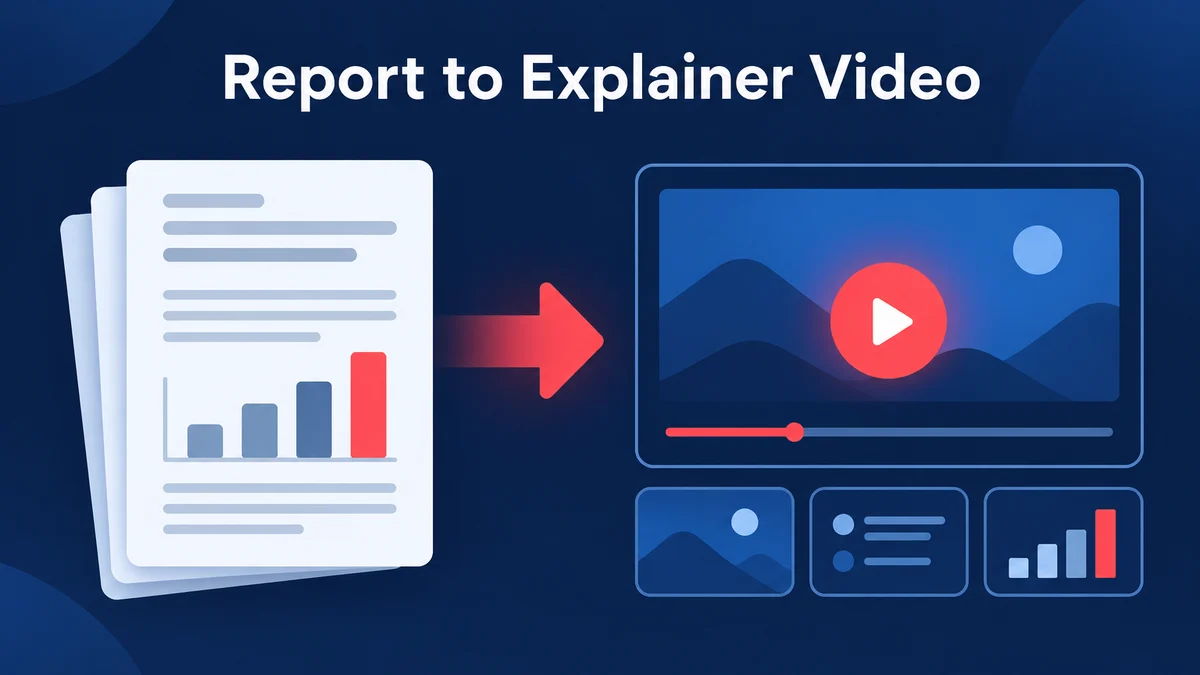
7. Annual report explainer
Use: present a long report to a general audience (a 20-page sustainability report from a fictional coffee company).
Format: 16:9, 58.7 seconds, six scenes, narrated.
Scene order: title, list, stat, list, quote, list.
Problem: the opening title and aim: a smaller footprint without raising prices.
Solution: the headline numbers in a list (energy per kilogram, share bought direct, plastic cups).
How it works: one stat scene for the largest number, then a list for what changed in roasting.
Next step: a list of goals for the following year.
Borrow: the quote scene admits a cost (compostable bags cost 18% more), so the video is not only good news. Include one honest limit.
8. Square report summary
Use: reduce the same report to a feed-sized summary: three numbers, one sentence each.
Format: 1:1, 22.1 seconds, five scenes. It started from the direction "Make a 20-second square summary of this report: three numbers, one sentence each."
Scene order: title, stat, quote, stat, title.
Problem: the title frames it as the report "in three numbers".
Solution: the three numbers, one per scene.
How it works: a stat scene for 41% less energy, a quote scene for 92% bought direct, a stat scene for zero single-use plastic cups.
Next step: a closing title names the source and says it is a fictional sample.
Borrow: one number per scene, and a closing line naming the source.
9. Quarterly review from a slide deck
Use: turn an eight-slide Q3 business review from a fictional bike company into a team video.
Format: 16:9, 47.4 seconds, eight scenes. It started from the direction to open with three Q3 numbers, then growth drivers and customer feedback, and end with Q4 priorities.
Scene order: title, list, stat, list, stat, list, title, list.
Problem: the review title and a list of the quarter's key figures.
Solution: the growth driver, shown as a stat (e-bike sales up 32%).
How it works: alternating lists and stats: new stores and online share, then the average customer rating and what customers asked for.
Next step: a "Q4 priorities" divider and a list of three priorities.
Borrow: alternate stat and list scenes so numbers do not read as a wall, and use a divider title before the plan.
Data and news explainer video examples
When the evidence is a number, the explanation is what it means. These three show a chart, a pasted article and a research summary. The animated chart maker page collects more data videos.
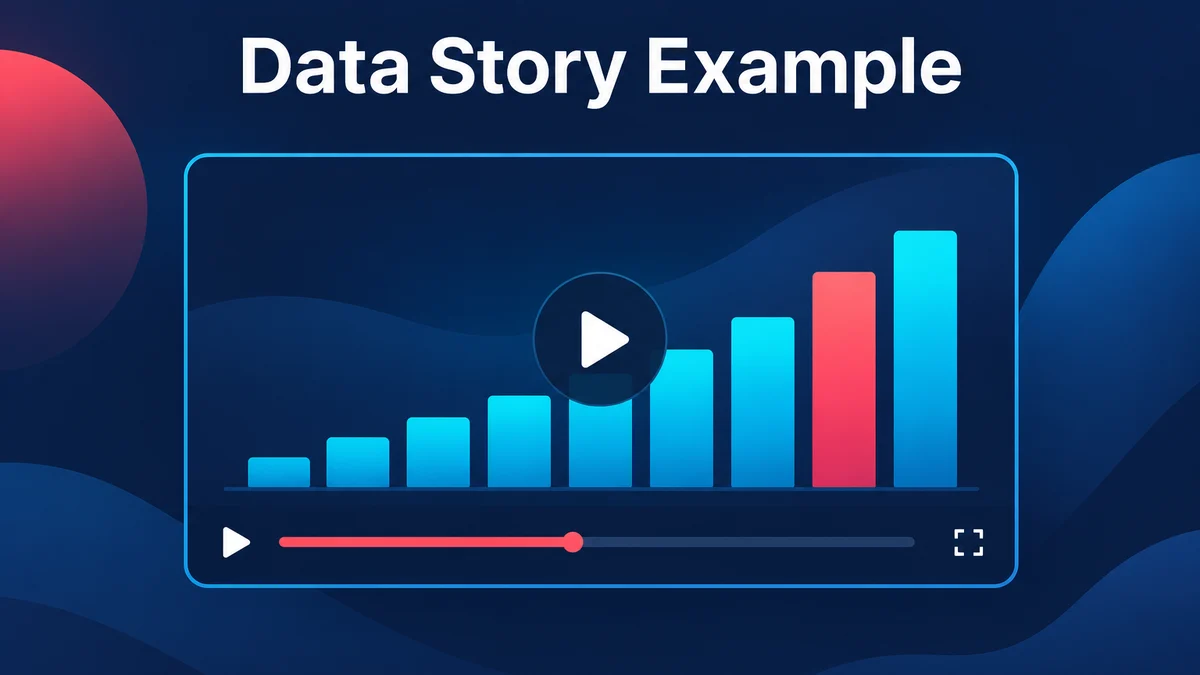
10. Monthly sales bar chart
Use: explain a trend from numbers written into a short brief.
Format: 16:9, 23.0 seconds, four scenes.
Scene order: hook, chart, compare, stat.
Problem: the hook asks how one summer changed a coffee shop's sales.
Solution: sales climbed every month.
How it works: an animated bar chart of average cups per day from June to September (120, 135, 150, 190), then a compare scene on cold brew's share of orders, 10% before and 28% after.
Next step: a stat scene gives the takeaway, a 58% rise in daily cups.
Borrow: put every figure in the brief, then check that each number spoken matches the chart.
11. Article summary for phones
Use: turn a pasted article into a short vertical video. The sample is a short article on green roofs.
Format: 9:16, 28.0 seconds, five scenes. It started from the direction to ask the question, give the three reasons and end on the trade-off.
Scene order: hook, title, list, title, quote.
Problem: the hook asks why cities are adding green roofs.
Solution: the three reasons, one per scene: cooler buildings, rain soaked up by soil, and small roofs that add up.
How it works: a title for reason one, a list that traces rainwater from a plain roof to a green one, a title for reason three.
Next step: a quote scene states the catch (extra weight and early plant care) and why many owners still find it worthwhile.
Borrow: end a persuasive explainer on the trade-off. Adobe advises vertical formats for Reels and Shorts; the YouTube Shorts maker page shows more.
12. Study summary for phones
Use: cut a research summary down to the question, the results and the limits. The sample is a fictional four-day-week pilot with 40 companies.
Format: 9:16, 24.9 seconds, five scenes.
Scene order: title, stat, title, stat, list.
Problem: the opening title asks whether teams can keep output steady on a four-day week.
Solution: output per team rose 2%.
How it works: a title for 35 of 40 companies keeping the four-day week, then a stat for sick days down 31%.
Next step: a list of limits: the companies self-selected, it ran for six months only, and each company measured its own output.
Borrow: give the limits their own scene, not a footnote. The article to video page shows the same approach with text.
What the 12 examples have in common
Laid side by side, the examples share a few habits:
Short. The shortest is 10.0 seconds and the longest 58.7, all well under the 90 seconds Adobe suggests as a ceiling. Eight of the 12 run between 20 and 40 seconds.
A few scenes. Three to eight, each a single beat.
One scene type per job. A list for steps, a stat for one number, a chart for a trend, a compare scene for a choice, a quote scene for a conclusion or a limit, and a call to action only where the viewer has something to do.
The first scene names the question or the topic. All 12 open on a title, a hook or a screenshot that establishes the subject before any number appears.
The last scene is a next step. It is a call to action, a takeaway, a decision rule, a list of goals or a list of limits.
Aspect ratio follows the place the video will be watched: nine are 16:9 for websites and presentations, two are 9:16 for phones and one is 1:1 for a feed. Potto exports 1080p MP4 at 30 fps in those three ratios. The same report appears as 16:9 and 1:1 above: one source, a different framing for each place.
An explainer video example checklist
Use this list on any explainer video example, or on your own draft, before you publish.
One message. Can you state the video's point in one sentence? If not, split it.
The problem comes first. Does the viewer recognise their situation in the first scene?
The solution is one sentence. Could a newcomer repeat it?
About three steps. Does each step get its own scene and short on-screen text that matches the narration?
Text stays readable. TechSmith advises keeping text on screen for at least three seconds.
Facts trace to the source. Check each name, number and date, and keep qualifiers in the same scene as the claim.
The ending is deliberate. Does the last scene say what to do, what to remember or where the claim stops?
The frame fits the place. 16:9, 9:16 or 1:1.
Make your own explainer video from an example
Pick the closest example, then give Potto your own source and a sentence of direction in the same shape: audience, length, style and beats, such as "open with three numbers, then what changed, then next year's goals."
Potto accepts a description, a public webpage link, or documents and images (PDF, PowerPoint or Word files up to 20 MB each, up to 8 attachments). Claude Opus 5.5 writes the outline, script and storyboard, and Remotion renders the scenes into a motion-graphics video with narration, captions and music that you edit scene by scene. Read more on AI motion graphics and the AI video generator.
Previews do not use credits; credits are charged when you export, and the total is shown before you confirm (see pricing). Potto does not make live-action footage or avatars and does not edit video you already have; every example here is built from text, documents, images and links.
FAQs
What are some good explainer video examples?
Good explainer video examples include a product demo, a feature walkthrough, an onboarding walkthrough, a concept lesson, a process training clip, a report summary, a data story and an article summary. This guide breaks down 12 from Potto's own samples by use, length, ratio, scene order and reusable structure.
What is the best structure for an explainer video?
The most common structure is the problem, then the solution, then how it works, then the next step. TechSmith maps it to a hook from 0 to 10 seconds, an explanation from 10 to 50 seconds and a call to action from 50 to 60 seconds, and Vyond and Adobe describe the same order. Keep each part to the scenes it needs and end on one clear action or takeaway.
How long should an explainer video example be?
Most guidance puts an explainer at about one to two minutes, and Adobe suggests under 90 seconds. The 12 examples run from 10.0 to 58.7 seconds; match the length to the number of points you have.
Are these explainer video examples real customer videos?
No. They are Potto's own sample videos. The document-based ones start from reports, decks and handouts that Potto wrote, so the companies, people and figures are fictional, and the other samples show Potto's own pages. They show what the tool does with a given input, not a customer's results.
Can AI make an explainer video like these?
Yes, an AI explainer video like these can be made from a topic, a link or a document. Potto uses Claude Opus 5.5 to write the script and storyboard and Remotion to render animated scenes with narration, captions and music. Review the facts yourself: a smooth voice does not make an explanation correct.
Potto AI pages for the sample videos: explainer video, product demo video, product walkthrough video, PDF to video, PPT to video, article to video, animated chart (checked 2026-10-10)