- 時長與比例
- 3:00
- 16:9
- 製作工具
- Canvas
- Audio
提示詞
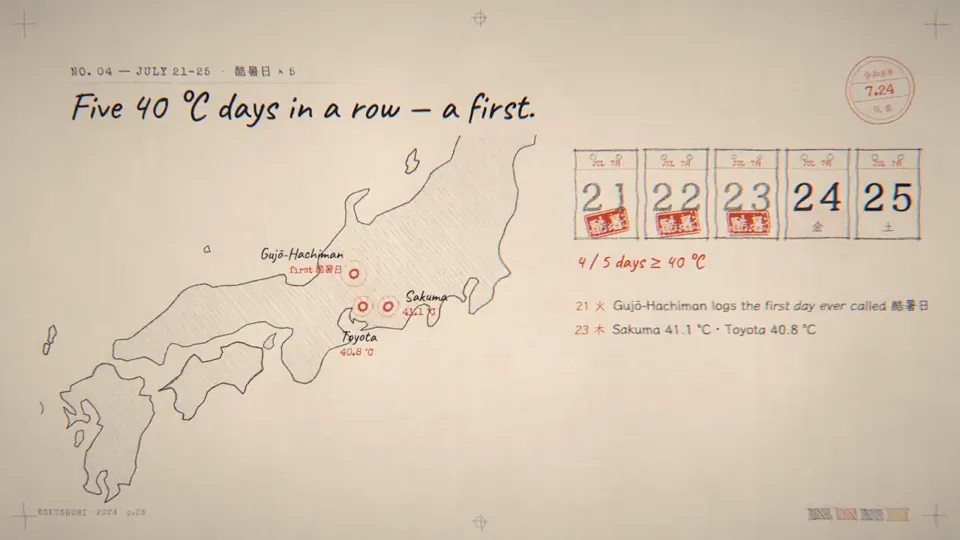
All right, this is an empty repo. Make me a 3-minute animated visualization using JavaScript, or you can do it in TypeScript if you want, about Japan's hot weather in 2026. Pull some online data to see why it was hot and how it compares to other years. I really want the animation to be visually appealing. I wanted to use a hand-drawn pencil style with a little bit of tasteful chromatic aberration. And maybe a bit of a pastiche look but it's supposed to look really, really cool. Also, use a JavaScript synthesizer to make a melody for this visualization that goes along with the theme.
更多類似影片
查看全部


選擇你的方案
同一份點數餘額,可用於 AI 影片與 AI 圖片。按月或按年訂閱,或一次性購買點數包。
2,000 點數
US$20一次性
一次付清 · 無訂閱
每包影片數
30 秒產品示範影片13 支
60 秒解說影片5 支
- 2,000 點數,一次入帳
- 最多 86 張快速生成圖片
- 不加上 Potto 浮水印
- 影片與圖片工具共用
5,000 點數
US$50一次性
一次付清 · 無訂閱
每包影片數
30 秒產品示範影片33 支
60 秒解說影片13 支
- 5,000 點數,一次入帳
- 最多 217 張快速生成圖片
- 不加上 Potto 浮水印
- 影片與圖片工具共用
15,000 點數
US$100一次性
一次付清 · 無訂閱
每包影片數
30 秒產品示範影片100 支
60 秒解說影片40 支
- 15,000 點數,一次入帳
- 最多 652 張快速生成圖片
- 不加上 Potto 浮水印
- 影片與圖片工具共用
Lite
選擇 LiteUS$20/月按月計費
每月影片支數
30 秒產品示範影片13 支60 秒解說影片5 支- 每月 2,000 點數
- 最多 86 張快速生成圖片
- 標準佇列
- 不加上 Potto 浮水印
- AI 工具批次處理
- 不列入公開作品集
Pro
選擇 ProUS$50/月按月計費
每月影片支數
30 秒產品示範影片33 支60 秒解說影片13 支- 每月 5,000 點數
- 最多 217 張快速生成圖片
- 優先排隊
- 不加上 Potto 浮水印
- AI 工具批次處理
- 不列入公開作品集
- 推薦
Max
選擇 MaxUS$100/月按月計費
每月影片支數
30 秒產品示範影片100 支60 秒解說影片40 支- 每月 15,000 點數
- 最多 652 張快速生成圖片
- 最高優先排隊
- 不加上 Potto 浮水印
- AI 工具批次處理
- 不列入公開作品集
Lite
-20%選擇 LiteUS$20US$16/月按年計費 · US$240 → US$192/年
每月影片支數
30 秒產品示範影片13 支60 秒解說影片5 支- 每月 2,000 點數
- 最多 86 張快速生成圖片
- 標準佇列
- 不加上 Potto 浮水印
- AI 工具批次處理
- 不列入公開作品集
Pro
-20%選擇 ProUS$50US$40/月按年計費 · US$600 → US$480/年
每月影片支數
30 秒產品示範影片33 支60 秒解說影片13 支- 每月 5,000 點數
- 最多 217 張快速生成圖片
- 優先排隊
- 不加上 Potto 浮水印
- AI 工具批次處理
- 不列入公開作品集
- 推薦
Max
-20%選擇 MaxUS$100US$80/月按年計費 · US$1,200 → US$960/年
每月影片支數
30 秒產品示範影片100 支60 秒解說影片40 支- 每月 15,000 點數
- 最多 652 張快速生成圖片
- 最高優先排隊
- 不加上 Potto 浮水印
- AI 工具批次處理
- 不列入公開作品集
Videos use credits when you export, and starting one needs a balance that covers its export. Counts assume a 30-second product demo and a 60-second explainer with narration and 3 illustrations.
Pencil-style infographic tracks Japan's hot summer 常見問題
Pencil-style infographic tracks Japan's hot summer 的製作方式、提示詞內容,以及如何用 Potto 做出同類的 數據故事 影片。
Pencil-style infographic tracks Japan's hot summer 是什麼?
Pencil-style infographic tracks Japan's hot summer 是 GroundControl 製作的 數據故事 類型 AI 動態圖形影片。 A three-minute pencil-style animated infographic on Japan's hot 2026 summer, with data comparisons and a synth melody.
Pencil-style infographic tracks Japan's hot summer 是怎麼製作的?
Pencil-style infographic tracks Japan's hot summer 使用 Canvas和Audio 製作,屬於 Potto 上 數據故事 分類的 AI Motion Graphics 影片。
可以查看 Pencil-style infographic tracks Japan's hot summer 的提示詞嗎?
可以。本頁有 Pencil-style infographic tracks Japan's hot summer 的完整提示詞。你可以複製,或點選「使用此提示詞」,在 Potto 工作區中開啟。
Pencil-style infographic tracks Japan's hot summer 有多長,畫面比例是多少?
Pencil-style infographic tracks Japan's hot summer 時長為 3:00,畫幅為 16:9。
我能用 Potto 做出像 Pencil-style infographic tracks Japan's hot summer 這樣的 數據故事 影片嗎?
可以。點選「使用此提示詞」,把 Pencil-style infographic tracks Japan's hot summer 的提示詞載入 Potto 工作區。Potto 會算繪自己的版本,匯出前你可以修改文字和風格。
在哪裡觀看 Pencil-style infographic tracks Japan's hot summer 的原片?
Pencil-style infographic tracks Japan's hot summer 最初由創作者發布。點擊「查看原片」,即可在新分頁開啟該貼文。
在哪裡可以找到更多像 Pencil-style infographic tracks Japan's hot summer 這樣的 數據故事 影片?
在 Potto 上瀏覽 數據故事 合集:26 支影片,每支都附有提示詞、規格和來源。