Datengeschichte
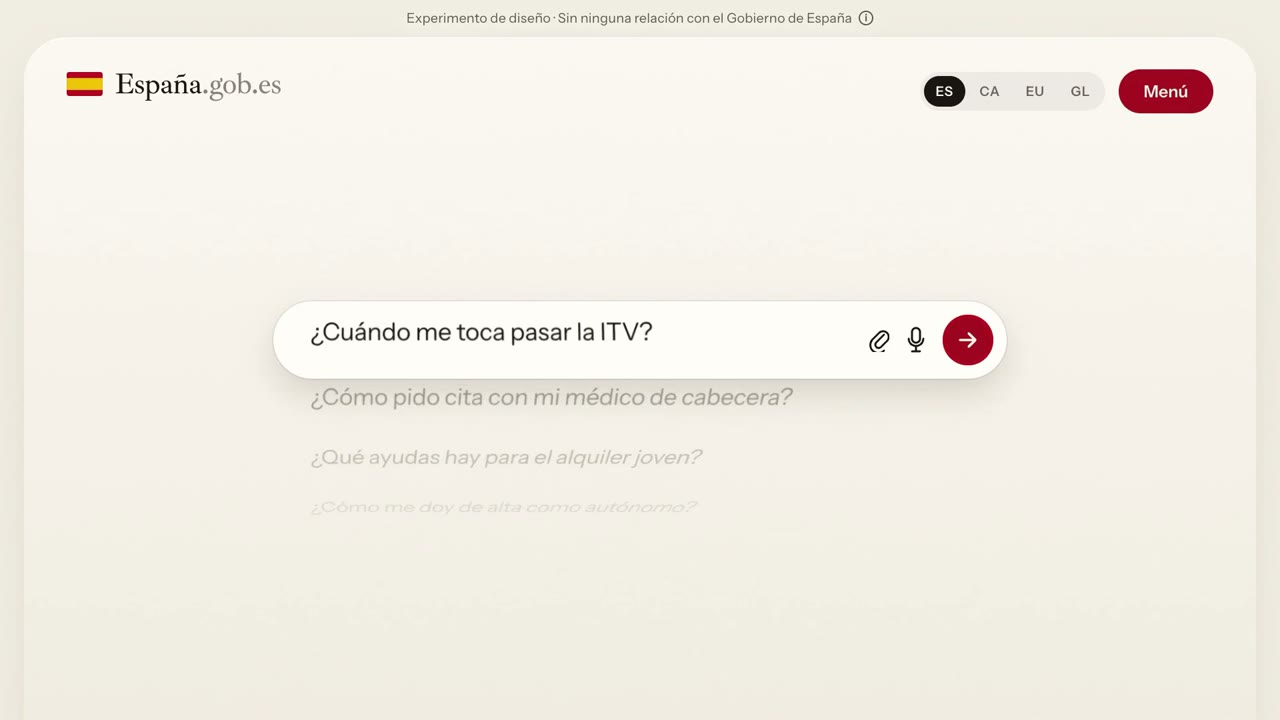
Spanish public services portal concept with a dot map of town halls
16:9 · 0:50
von jgarcelan
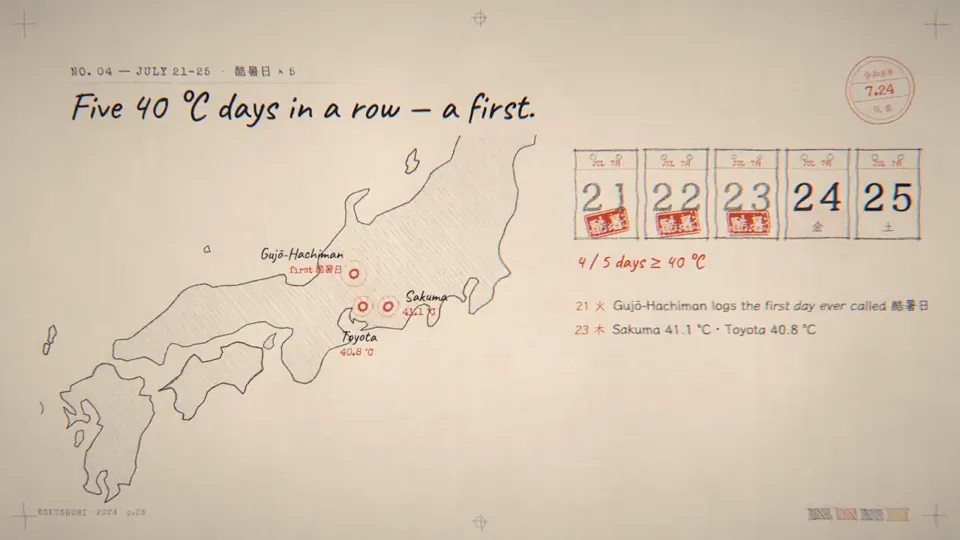
All right, this is an empty repo. Make me a 3-minute animated visualization using JavaScript, or you can do it in TypeScript if you want, about Japan's hot weather in 2026. Pull some online data to see why it was hot and how it compares to other years. I really want the animation to be visually appealing. I wanted to use a hand-drawn pencil style with a little bit of tasteful chromatic aberration. And maybe a bit of a pastiche look but it's supposed to look really, really cool. Also, use a JavaScript synthesizer to make a melody for this visualization that goes along with the theme.
Datengeschichte
16:9 · 0:50
von jgarcelan

Ein Credit-Guthaben für KI-Videos und KI-Bilder. Monatlich oder jährlich abonnieren oder einmal ein Credit-Paket kaufen.
Einmal zahlen · kein Abo
Videos pro Paket
Einmal zahlen · kein Abo
Videos pro Paket
Einmal zahlen · kein Abo
Videos pro Paket
Monatliche Abrechnung
Videos pro Monat
Monatliche Abrechnung
Videos pro Monat
Monatliche Abrechnung
Videos pro Monat
Jährliche Abrechnung · 240 $ → 192 $/Jahr
Videos pro Monat
Jährliche Abrechnung · 600 $ → 480 $/Jahr
Videos pro Monat
Jährliche Abrechnung · 1.200 $ → 960 $/Jahr
Videos pro Monat
Videos use credits when you export, and starting one needs a balance that covers its export. Counts assume a 30-second product demo and a 60-second explainer with narration and 3 illustrations.
Wie Pencil-style infographic tracks Japan's hot summer entstand, was der Prompt sagt und wie Sie mit Potto ein ähnliches Datengeschichte-Video erstellen.
Pencil-style infographic tracks Japan's hot summer ist ein Motion-Graphics-Video in der Kategorie Datengeschichte von GroundControl. A three-minute pencil-style animated infographic on Japan's hot 2026 summer, with data comparisons and a synth melody.
Pencil-style infographic tracks Japan's hot summer wurde mit Canvas und Audio erstellt. Es gehört zur Datengeschichte-Sammlung der KI-Motion-Graphics-Videos auf Potto.
Ja. Der vollständige Prompt hinter Pencil-style infographic tracks Japan's hot summer steht auf dieser Seite. Kopieren Sie ihn, oder klicken Sie auf „Diesen Prompt verwenden“, um ihn im Arbeitsbereich von Potto zu öffnen.
Pencil-style infographic tracks Japan's hot summer dauert 3:00 und nutzt ein 16:9-Format.
Ja. Klicken Sie auf „Diesen Prompt verwenden“, um den Prompt hinter Pencil-style infographic tracks Japan's hot summer in den Arbeitsbereich von Potto zu laden. Potto rendert eine eigene Version, und Sie können Text und Stil vor dem Export ändern.
Pencil-style infographic tracks Japan's hot summer wurde zuerst von der erstellenden Person veröffentlicht. Klicken Sie auf Original ansehen, um diesen Beitrag in einem neuen Tab zu öffnen.
Durchsuchen Sie die Datengeschichte-Sammlung auf Potto: 26 Videos, jeweils mit Prompt, Angaben und Quelle.